Health Promotion
A Population and Systems Approach: Health promotion must address the environmental, economic, and social factors that influence health behaviors.
The scale of the global cancer burden and its associated economic costs indicate that adoption of healthy behaviors to reduce the risk of cancer is critical. However, behavior change initiatives directed at individuals are not likely to be successful without addressing the many external factors that influence behavior. In addition to educating and building skills that encourage healthier behaviors, health promotion must also include efforts to address the environmental, economic, and social factors that influence an individual’s ability to engage in those behaviors. For instance, the availability of sidewalks and biking infrastructure affects the degree of physical activity in a community, and the availability of affordable fresh fruits and vegetables affects healthy eating habits. This is especially important in the context of health equity, as vulnerable populations are most affected by environments that are not conducive to healthy behaviors.
Health cannot be a question of income; it is a fundamental human right.
A comprehensive policy framework to create environments that support following cancer prevention recommendations includes actions at the environmental, system, and individual levels. (Figure 1) While this framework was developed to address diet, physical activity, breastfeeding, and alcohol consumption (all factors associated with cancer risk and/or body weight), the broad policy levers are applicable to other health behaviors, such as tobacco use and vaccination. Examples of initiatives include taxation, (Figure 2) information and community mobilization, (Figure 3) and counseling in healthcare. (Figure 4)
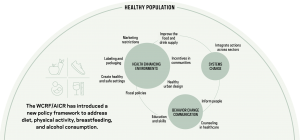
Figure 1. World Cancer Research Fund/ American Institute for Cancer Research (WCRF/AICR) policy framework. The WCRF/AICR has introduced a new policy framework to address diet, physical activity, breastfeeding, and alcohol consumption.
Health-enhancing environments includes: improve the food and drink supply; incentives in communities; healthy urban design; fiscal policies; create healthy and safe settings; labeling and packaging; and marketing restrictions.
Systems change includes integrate actions across sectors.
Behavior change communication includes: inform people; counseling in healthcare; and education and skills.
In addition, Philadelphians were 58 percent more likely to drink bottled water every day.
A 2017 modelling study examining the potential impact of product reformulation estimated that, with reduced sugar content by 15–30%, the number of adults and children with obesity would fall by 144,000, and there would be 19,000 fewer cases of diabetes per year in the UK.
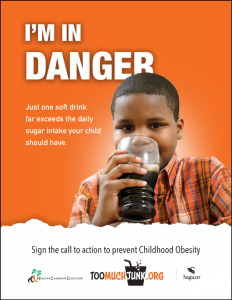
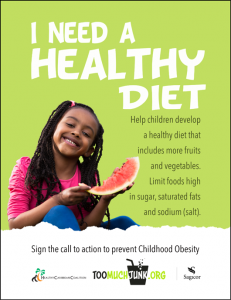
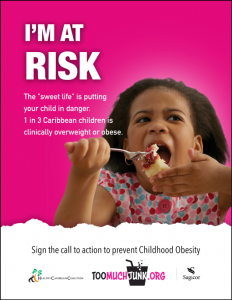
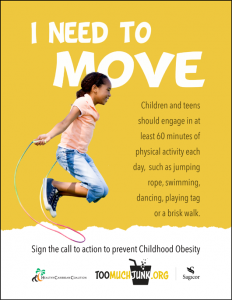
Figure 3. Education and Information: The Healthy Caribbean Coalition #toomuchjunk Campaign. Posters by Health Caribbean Coalition advocating healthy diet and physical activity for children, including: “I’m in danger” poster of child drinking soda; “I need a healthy diet” poster of child eating melon; “I’m at risk” poster of child eating cake; and “I need to move” poster of child jumping rope.

Figure 4. Counseling in healthcare: Green Prescriptions (New Zealand).
A Green Prescription (GRx) is the written advice from a health care professional to a patient to be physically active. The program is administered by District Health Boards, with support from the New Zealand Ministry of Health. Patients receiving a GRx from their health care provider are eligible for ongoing support, delivered as monthly telephone calls, face to face meetings, or group support in a community setting. The patient’s progress is reported back to the referring health professional. A retrospective study of individuals who had participated in the GRx program two to three years earlier found that those who had completed the program reported an additional 64 min of total physical activity per week and were less likely to be sedentary and more likely to meet the current physical activity guidelines of at least 150 min of physical activity per week.
ACCESS CREATES PROGRESS
In the Netherlands, substantial investments have been made in cycling-promoting infrastructure and policies, resulting in 27% of trips being made by bicycle. This physical activity is estimated to avert 6,500 deaths annually and contribute an additional half-year to the life expectancy of Dutch people.
Access creates progress:
Fishman E, Schepers P, Kamphuis CBM. Dutch Cycling: Quantifying the Health and Related Economic Benefits. Am J Public Health. 2015;105(8):e13-e15.
Text and Figure 1:
World Cancer Research Fund/ American Institute for Cancer Research. Continuous Update Project Expert Report 2018. Recommendations and public health and policy implications. Available at dietandcancerreport.org.
Figure 2:
Briggs ADM, Mytton OT, Kehlbacher A, et al. Health impact assessment of the UK soft drinks industry levy: a comparative risk assessment modelling study. Lancet Public Health. 2017;2:e15-22.
Colchero MA, Popkin BM, Rivera JA, Ng SW. Beverage purchases from stores in Mexico under the excise tax on sugar sweetened beverages: observational study. BMJ. 2016;352:h6704.
Zhong Y, Auchincloss AH, Lee BK, Kanter GP. The Short-Term Impacts of the Philadelphia Beverage Tax on Beverage Consumption. Am J Prev Med. 2018;55(1):26–34.
Figure 3:
Used with permission from Healthy Caribbean Coalition. Campaign materials. Available from: https://www.toomuchjunk.org/campaign-materials.html
Figure 4:
Hamlin MJ, Yule E, Elliot CA, Stoner L, Kathiravel Y. Long-term effectiveness of the New Zealand Green Prescription primary health care exercise initiative. Public Health. 2016;140:102–108.