
|
Scooped by
Beth Kanter
onto Visualization Techniques and Practice |


No comment yet.
Sign up to comment
Get Started for FREE
Sign up with Facebook Sign up with X
I don't have a Facebook or a X account


|
|
Scooped by
Beth Kanter
onto Visualization Techniques and Practice |
 Your new post is loading...
 Your new post is loading...
Your new post is loading...
This is a basic 101 and introduction to data visualization for nonprofits based on a NTEN session in 2012 - I created a wiki. Then I decided I needed to curate on this topic and doing that here.
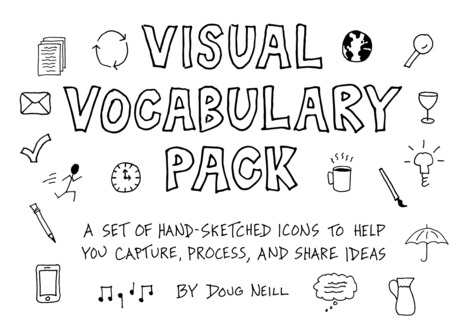
The Visual Vocabulary Pack includes: Individual hand-sketched icons in PNG and vector format, Compilation pages for printing or quick-viewing of all icons, Suggestions for how to use these icons to better capture, process, and share ideas. If you're ready to communicate visually but need help getting started, this pack will fit you well. More info at www.verbaltovisual.com/resources. Happy sketching, Doug
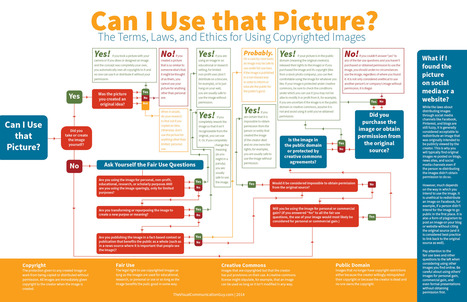
When you find a picture online that would be perfect for your project, it's hard to know whether you're allowed to use it. Follow this flow chart to know for sure and avoid getting yourself in any trouble.
Beth Kanter's insight:
Useful e-book on micro content - context, tips, strategy, and tools.
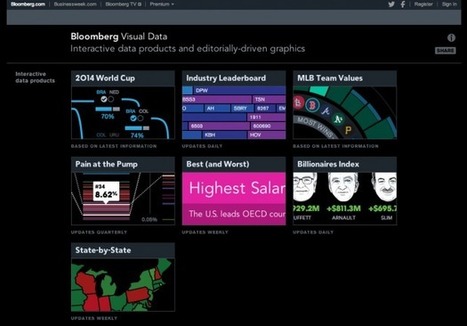
Infographics, data visualizations, and interactive visual projects are popular for a reason. They capture imaginations, command attention, and teach new things. Above all, however, they are simply fun to look at. If you’ve spent some time getting lost in all of the projects on Visually’s community page, you know what I mean. As visual content has exploded in popularity over the past few years, so have the places to discover the best ones. Check out five of our favorites below. 1. I Love Charts Curated by: Jason Oberholtzer, Cody Westphal, “Chartists in Residence” | @ilovecharts I Love Charts is one of the best known visual blogs on the web. Created by Jason Oberholtzer and Cody Westphal in 2009, the Tumblr has been going strong ever since. There are multiple posts every day from either Oberholtzer, Westphal, or their team of Chartists, who contribute a wide range of content. I Love Charts:... keep reading
Beth Kanter's insight:
Infographics, data visualizations, and interactive visual projects are popular for a reason. They capture imaginations, command attention, and teach new things. Above all, however, they are simply fun to look at. If you’ve spent some time getting lost in all of the projects on Visually’s community page, you know what I mean. As visual content has exploded in popularity over the past few years, so have the places to discover the best ones. Check out five of our favorites below.
The push for visual content seems is only getting stronger. Here are some of our favorite ideas, tips, and tools to help produce great images. Via Stefano Principato

Stefano Principato's curator insight,
June 17, 2014 5:17 AM
9 major types of visual content
What are we specifically talking about when we talk about visual content? I sometimes lose track of this myself. There will eventually be an end product to a visual content strategy. Here are the most common ways that marketers create visual content.

Shreya's curator insight,
June 17, 2014 6:38 AM
Poonam Pandey dances to football fever http://www.eni.network24.co/photo-gallery/poonam-pandey-dances-to-football-fever-10914_10
"Visual content” is the hot new term in content marketing. But what does it really mean, and how can you use it to your advantage? Check out this SlideShow t...

Monica Norton's curator insight,
June 2, 2014 1:00 PM
Great overview of visual content from Column Five. What is visual content, what's the ROI, why does it matter? 
Stephen Dale's curator insight,
June 4, 2014 7:44 AM
The Taxonomy of Visual Content slide is particularly useful.

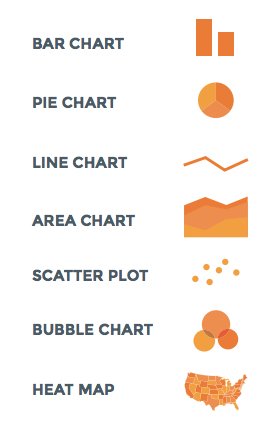
Beth Kanter's curator insight,
May 29, 2014 10:16 AM
Really useful guide to selecting and designing charts and graphs to visualize your data.
Follow these steps for creating knockout infographics that can give your marketing a visual flair.

One of the topics I was asked about recently by Vocus was about the influence of visual content. I wanted to add some color to my original remarks, which you can find here. Visual content is the fancypants new term for what we used to call rich media, and it’s in fact a subset of [...]
Beth Kanter's insight:
Test do decide if your content should be visual or not.
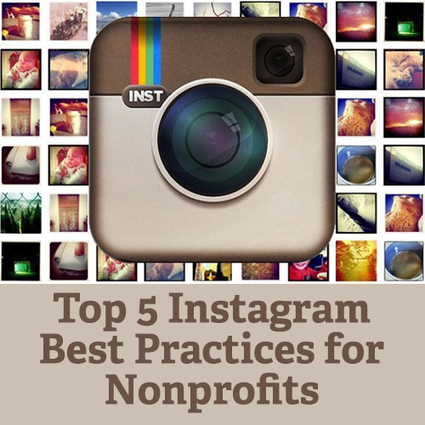
The following is an excerpt from Mobile for Good: A How-To Fundraising Guide for Nonprofits. Owned by Facebook, Instagram is the largest mobile social network in the United States. With more than h...
Beth Kanter's insight:
via John Kenyon
|
The details about the following nine word cloud generators will give you a fair idea how, as an educator, you can get the best out of them.
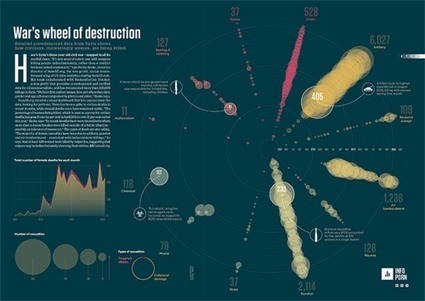
SumAll.org and Humanitarian Tracker teamed up with WIRED UK to visualize data about the killing of women and girls in Syria.
Beth Kanter's insight:
Crowdsourced data

The inspiration for your next visual content project is probably hiding right under your nose. Here are six easy ways to find your next standout piece.
Beth Kanter's insight:
The good news is, the inspiration for your next visual project is probably hiding right under your nose. Where to find data: 1. Your Company's Data 2. Survey you conductor or sponsor 3. From a partner 4. Government Data 5. Social Media streams 6. Older Content
Infographics can be powerful communications tools for fundraisers. Done well, they can express complex issues in a compelling way and demonstrate impact. A form of curation, they can also demonstrate a charity's expertise on its subject. They are one way that charities and nonprofits can harness 'big data' - theirs, and that of others. They also tend to be shared widely via digital media. Which fundraising infographics have we missed? Find us at www.fundraising.co.uk.
Beth Kanter's insight:
Howard Lakes awesome collection of fundraising infographics.
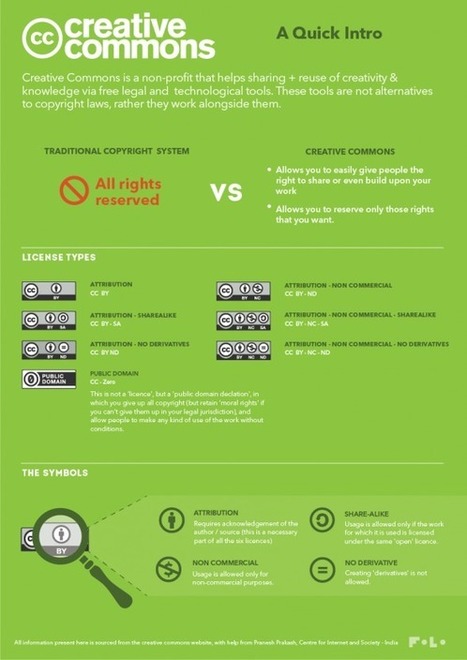
This guide will help you find and correctly attribute public domain and Creative Commons images for your project or presentation.
Aaron Lee of Post Planner shares tops tips for 8 Ways To Use Visuals To Market Your Business on Facebook
Beth Kanter's insight:
Practical advice for visual content
Visual Skills to the ticket out of being overwhelmed
-------------- This piece was posted by Loren Sorenson for Hubspot, I selected it because as she says "If you aren’t prepared for the visual content revolution, you may be left in the dust.
Not convinced? Let's take a look at exactly how visual contentis positively contributing to marketing strategies -- it may just give you the push you need
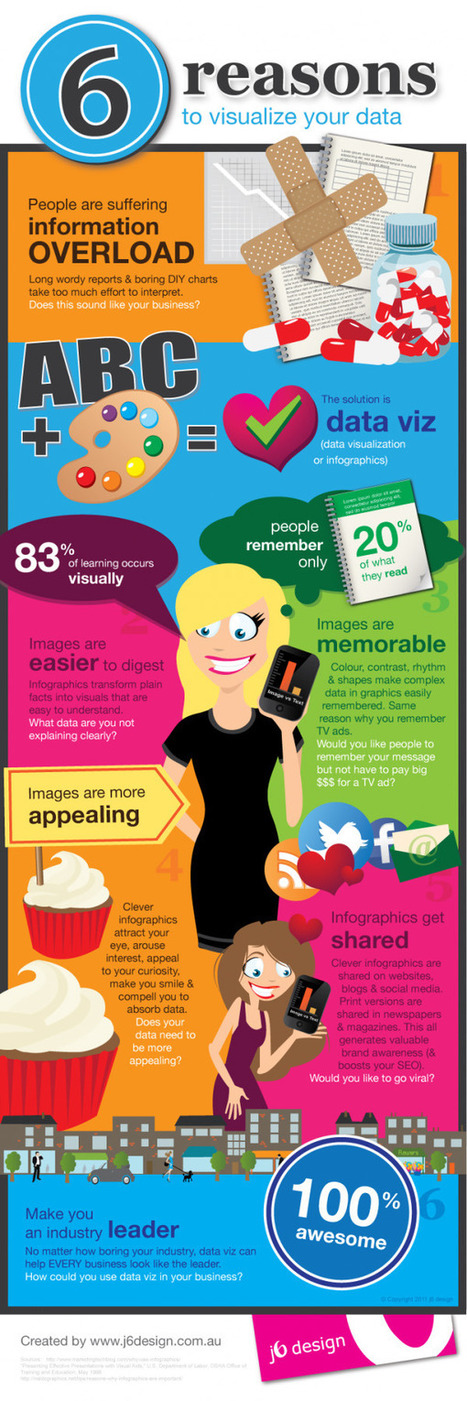
"Learn why visual content is a critical part of your content creation strategy.
Here are some highlights:
**People remember only 20% of what they read
**83% of learning is visual
Condenses and Explains Large Amounts of Information
**Today, there is too much information on the Internet you have about 3 seconds to catch someone’s eyes so they'll consume your information.
Gives Your Brand an Identity
**Visual content draws people in, letting viewers better understand your brand's identity
Drives User Engagement
**If you've ever read a book with a child, you probably know they find pictures more interesting than words; but are adults really that different?
Selected by Jan Gordon covering "Content Curation, Social Business and Beyond"
Read full article here: [http://bit.ly/Ifujbp] Via janlgordon

janlgordon's comment,
April 11, 2012 3:21 PM
Beth Kanter
Thank you for adding me to the wiki and for your kind words, it's greatly appreciated. Yes this is the conversation of the moment so to speak. I'm sure your presentation was amazing. Would love to hear it if you have a replay.
Beth Kanter's comment,
April 11, 2012 10:08 PM
Jan: There's a link in the wiki to the live stream of the session - and a lot of notes and resources ... I love this topic! I'm holding myself back from created another scoop.it on it ...
janlgordon's comment,
April 13, 2012 10:05 PM
Beth Kanter
Thanks for looking forward to seeing this info. Knowing you, I can imagine that you want to start another scoopit on this topic but it's not necessary because you're already doing a wonderful job covering it now.

Discover Instagram best practices for brands and why it’s important for them to tap into this mega social network.
Beth Kanter's insight:
via Jen Price
|


Useful e-book on micro content - context, tips, strategy, and tools.